What is a crosstab analysis?
Crosstab analysis is a statistical method used to identify patterns and trends between two or more variables. Researchers use cross-tabulation questions for multivariate analysis to make informed decisions. Sometimes, the raw data is too overwhelming and may point towards several possible outcomes. Crosstab analysis surveys help researchers zero-in on a theory without doubt by drawing comparisons, trends, and correlations.
Cross tabulation is also known as a contingency table. It is used in statistics to compare categorical data. Researchers generally use crosstab analysis to examine relationships between data that are not so evident using other research techniques.
Example of crosstab analysis
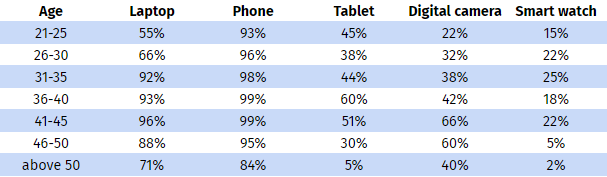
For example, a researcher wants to analyze the relationship between a person’s age and his/her usage of electronic gadgets. He/she asks these two questions:
- What is your age?
- What gadgets do you currently use?

Uses of the crosstab question
Researchers use the crosstab question on categorical data to understand and examine the relationship between two or more variables. Crosstab analysis is necessary for market research studies to make informed decisions by gauging relationships. Here are a few real-life uses of crosstab questions:
- Human resources: To understand employee satisfaction through employee engagement and exit interview surveys and make the necessary improvements.
- Educational institutions: To gauge student satisfaction levels through instructor evaluation surveys to refine the educational experience.
- Product and market research: To conduct customer satisfaction surveys and understand reactions based on demographics.
Advantages of crosstab survey questions
Crosstab surveys are among the most helpful questions to use in research. Here are the advantages of crosstab analysis::
- Simple to compute: Crosstab analysis is straightforward to understand. Interpreting results is simple too.
- Eliminates confusion: Raw data is often confusing, but crosstab analysis simplifies the data.
- Many insights: Numerous insights can be drawn from crosstabs and hence is a handy research tool.
- Easy data showcasing: It is easy to showcase data across two or multiple variables with ease.
- Usable across different types of data: Crosstab analysis is flexible and usable across different types of data.
How to use crosstab analysis?
Learn how to set up and use this feature with our help file on crosstab reports.
 Survey Software
Easy to use and accessible for everyone. Design, send and analyze online surveys.
Survey Software
Easy to use and accessible for everyone. Design, send and analyze online surveys.
 Research Suite
A suite of enterprise-grade research tools for market research professionals.
Research Suite
A suite of enterprise-grade research tools for market research professionals.
 Customer Experience
Experiences change the world. Deliver the best with our CX management software.
Customer Experience
Experiences change the world. Deliver the best with our CX management software.
 Employee Experience
Create the best employee experience and act on real-time data from end to end.
Employee Experience
Create the best employee experience and act on real-time data from end to end.